

Three years ago, I stepped on my digital bathroom scale after four straight weeks of disciplined eating and heavy lifting. The display blinked, stabilized, and delivered a gut punch: I had gained 1.4 pounds.
Frustration almost drove me to slash my intake. Instead, I grabbed my calipers and an old pair of tailored denim jeans. The waistband had two fingers of slack that had never existed before. My body had shed genuine visceral and subcutaneous fat, yet the scale told a lie.
Relying exclusively on non scale victories to track weight loss progress rescued my mental sanity and my long-term physiology. When your scale stalls during a fat loss phase, you are rarely plateauing. You are experiencing body recomposition, fluid shifts, and structural adaptation.
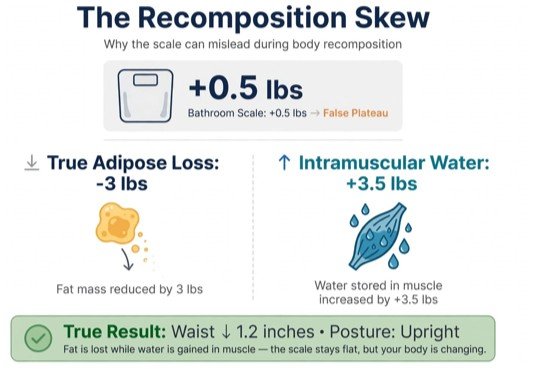
A standard scale measures total gravitational pull. It cannot distinguish between a pound of subcutaneous adipose tissue, half a liter of retained water, unevacuated GI tract waste, or dense skeletal muscle mass.
When you establish a structured program, you will often calculate calorie deficit for weight loss to initiate a steady fat-loss phase. Yet, systemic inflammation from resistance training forces muscle tissue to hold micro-droplets of water for tissue repair. Research published by the National Institutes of Health (NIH) demonstrates that fluid balance can swing systemic body weight by two to five pounds in a single twenty-four-hour cycle.
Every single gram of stored muscle glycogen bonds with three to four grams of water. If you consume a slightly higher carb intake on a recovery day, your scale will spike the next morning.
Elevated cortisol from work stress or hard training sessions triggers aldosterone secretion. Aldosterone commands your kidneys to hold sodium and water. Your body sheds fat while simultaneously storing water in vacated fat cells, masking your true metabolic progress.
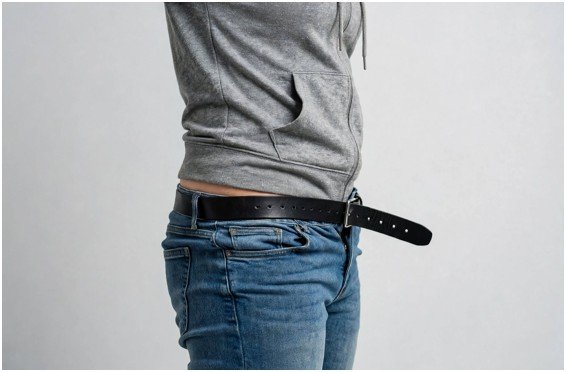
+—————————————————————–+
| PHYSICAL MARKER | WHAT IT REVEALS |
+—————————————————————–+
| Belt notches / Seated waist | Visceral fat reduction |
| Knee-to-chest clearance | Deep pelvic fat loss |
| Rib cage & collarbone edges | Subcutaneous fat depletion |
| Lower back arch comfort | Decreased anterior pelvic tilt |
+—————————————————————–+
Standing in front of a mirror can deceive you because lighting and posture mask gradual changes. Instead, pay attention to seated clearance.
When you sit on a firm chair, observe how your thighs spread and where your waistband settles against your lower abdomen. During deep fat loss, you will notice a distinct reduction in lateral abdominal compression when driving or tying your athletic shoes.
Measuring tape confirms these structural shifts. The Centers for Disease Control and Prevention (CDC) identifies waist circumference as a primary independent indicator of visceral fat loss and long-term metabolic health. When your waist drops two centimeters while your total scale weight remains pinned to the floor, you are actively burning dangerous deep-belly fat.
Carrying excess mass forces your pelvis into an anterior tilt, compressing your lumbar spine and stressing your patellar tendons. One of the earliest markers I look for is effortless upright posture.
You will stand taller without consciously squeezing your scapulae together. Your knees will track smoothly over your second toe without a grinding sensation during unweighted lunges. Less mechanical load translates to immediate joint relief long before your bathroom scale registers a monumental milestone.
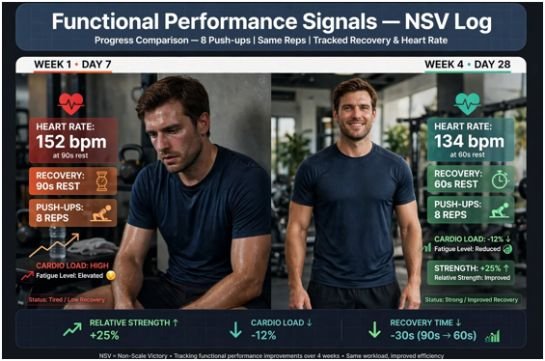
True fat loss preserves strength while elevating relative athletic output.
+————————————————————-+
| PERFORMANCE NSV LOG |
| |
| Week 1: 8 Push-ups @ 90s rest -> Heart rate: 152 bpm |
| Week 4: 8 Push-ups @ 60s rest -> Heart rate: 134 bpm |
| |
| Verdict: Relative strength up; cardiorespiratory load down. |
+————————————————————-+
In my personal logs, I track the “Double Progression Density” method. If I can lift the same absolute load for ten repetitions while trimming my rest period from ninety seconds to sixty seconds, my relative work capacity has climbed.
Guidelines from the American Council on Exercise (ACE) show that progressive overload accompanied by stable scale weight indicates clean skeletal muscle preservation with concurrent body fat reduction. You will fly through warm-up sets that used to gas you out.
Functional adaptations reveal themselves outside gym walls:
These micro-movements reflect improved power-to-weight ratios that static numbers cannot replicate.

Your autonomic nervous system reflects your physical condition. As visceral adipose stores shrink, airway resistance drops dramatically during supine sleep.
My wearable monitors demonstrated a thirty-minute leap in restorative deep sleep phases within six weeks of focused nutritional changes, even as my scale stayed dead even. The Harvard T.H. Chan School of Public Health points out that uninterrupted sleep stages regulate your circulating leptin and ghrelin levels, suppressing erratic hunger spikes throughout the day.
When you depend entirely on high-glycemic snacks, your afternoon energy plunges. As insulin sensitivity recovers through proper food choices, your energy flatlines in a positive way.
You no longer suffer the sudden 3:00 PM cognitive fog. You can delay a planned meal by ninety minutes without feeling shaky, nauseous, or irritable. This metabolic stability is unequivocal proof that your liver and muscle tissue are utilizing body fat reserves cleanly.
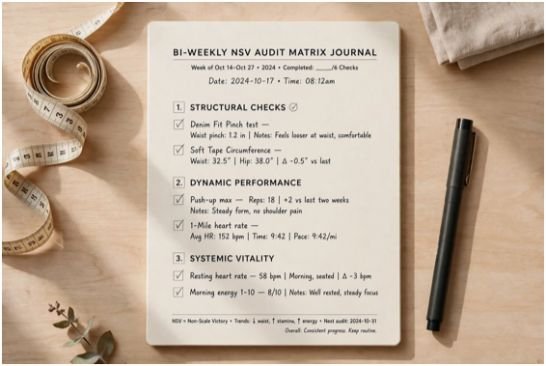
Do not abandon metrics entirely; simply change the variables you evaluate. I use a single-page journal to track three distinct domains every other Sunday morning:
+———————————————————————–+
| BI-WEEKLY NSV AUDIT MATRIX |
+———————————————————————–+
| 1. Structural Checks |
| – Standard Denim Fit (Pinch test at high hip: loose/neutral/tight) |
| – Soft Tape Circumference (Umbilicus, widest glute, mid-thigh) |
| |
| 2. Dynamic Performance |
| – Push-up or Dead-hang maximum duration to technical failure |
| – 1-Mile walking or jogging average heart rate |
| |
| 3. Systemic Vitality |
| – Average weekly resting heart rate |
| – Morning energy self-rating (Scale of 1-10) |
+———————————————————————–+
Once you reach a sustainable body composition, this exact matrix helps you maintain weight after losing it by warning you of lifestyle drift weeks before the scale flashes an alert.
Stop letting a bathroom scale dictate your daily mood. If your belt sits looser, your morning energy holds firm, and your weights in the gym feel lighter in your hands, you are winning the biological war against stored fat.
Pick two non-scale metrics from this guide today. Measure them every two weeks under identical conditions, track the data quietly, and let the mirror confirm what the scale is too clumsy to recognize.
Looser waistbands, deeper sleep without midnight awakenings, and an absence of late-afternoon energy crashes typically surface in the first two weeks.
Audit your body circumference and performance metrics once every fourteen days to bypass normal daily water weight spikes.
Yes; simultaneous muscle hypertrophy and adipose tissue loss will hold total scale weight identical while your waist size shrinks.
Muscle tissue is roughly eighteen percent denser than adipose tissue, meaning you occupy less physical volume at the exact same weight.